Apertures in Optical Design – OSLO Tips & Techniques
During the optimization phase of optical design, the apertures of lens elements are usually irrelevant. The curvatures and thicknesses determine the ray trajectories, while the apertures only determine whether or not rays can pass through the system. Accordingly, OSLO is arranged so that the beams passing through the system are specified in terms of the entrance beam diameter and field angle, or object height and numerical aperture, independently of the apertures. It is assumed that apertures can be assigned to the various surfaces to coincide with the actual beams transmitted by the system (this is not always true). On the other hand, during the part of optical design that involves image analysis, the role of apertures is different. In particular, it is important that the beams that are analyzed are physically realizable. For this to happen, the apertures of surfaces must be correctly specified, fully illuminated, and checked during ray tracing. Each ordinary aperture in a system can be specified as checked or unchecked. Special apertures, if specified, are always checked during evaluation routines (but not during optimization). It is usually not necessary to specify that all apertures are checked. Only certain controlling apertures need to be checked during ray tracing to ensure that beams are properly limited. For example, in the demotrip lens shown below, the apertures of the first and last surface control off-axis beams, and the aperture stop surface (surface 4) controls the on-axis beam.
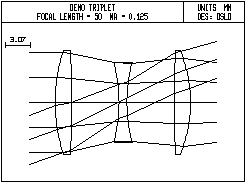
For this lens, checked apertures are only placed on surface 1 and 6. The on-axis beam diameter is determined by the entrance beam diameter, not the aperture stop. In such a case, the numerical aperture of the system is determined by the numerical aperture of the illuminating beam, and the paraxial constants correctly describe the system. Suppose, however, that the negative element is square instead of circular. Then there is a problem, because the illuminating beam does not fill the corners of the square aperture, which means that evaluation routines such as spot diagrams will produce incorrect results.
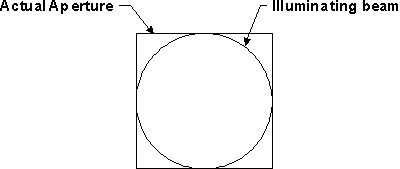
In such a case, it is necessary to increase the size of the illuminating beam and put a checked square aperture on the stop surface, as shown below. The system is then said to have on-axis vignetting.
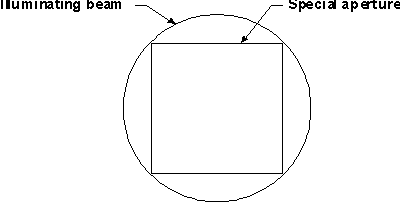
Now, the aperture is fully illuminated, so the spot diagram evaluation will be correct. However, the extent of the meridional section of the on-axis beam is no longer determined by the entrance beam radius, which means that the numerical aperture as reported by the paraxial constants command will not be correct (actually, it is not well-established what is meant by the numerical aperture under these circumstances). The spot diagram routine itself can be very useful in setting up systems that have unusual apertures. The general technique is to compute a spot diagram with a fine grid size, and observe the spot diagram not on the image plane, but on a pupil plane. This can be done by either applying a large focus shift to a normal spot diagram, or alternately by resetting the image surface number using the ims command. For example, consider the demotrip lens with a square aperture stop, as shown above:
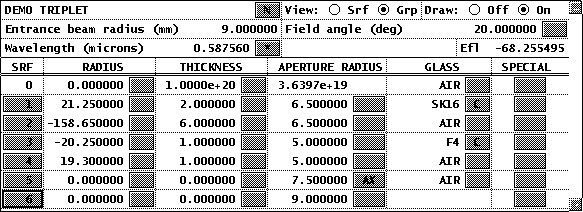
1. Open the demotrip.len file. Open the surface data spreadsheet, then delete the third element by selecting rows 5 and 6 and using the cut (scissors) tool on the spreadsheet toolbar. Insert a new surface in front of the image surface, make it the aperture stop, and change the thickness of surface 4 to 1.0. Now put a square checked aperture on the new surface: Select Special Aperture Data from the pop-up list that appears when you press the Aperture options button, enter 1 Special Aperture, and fill in the spreadsheet as shown below.
3. Click on the F6 toolbar icon and set the Wavefront Ref Sph position to infinity.
4. Next, open the Update >> Operating Conditions >> Lens Drawings spreadsheet, change the Draw aperture stop option to On, set the number of field points to 1, and the number of rays from that field point to 21. Then close the spreadsheet. The Autodraw window should appear as follows.
5. Now, compute a spot diagram, setting the aperture divisions to 41.05. Then use Calculate >> Display Spot Diagram to plot the spot diagram with a scale of 5.5, as follows.
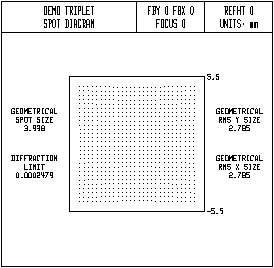
The spot diagram shows that the aperture is correctly filled, so that a square grid of rays is transmitted through the system. (If you change the entrance beam radius back to 6.25, its original value, you will see that the beam becomes circular, indicating that the aperture is not filled.) There is a small residual problem in the distribution of rays, in that the ray spacing is not uniform across the pupil. The reason for this is the pupil aberration introduced between the entrance pupil and the aperture stop. OSLO has a special operating condition called warm, which causes rays to be aimed at the aperture stop rather than the entrance pupil.
6. Open the general operating conditions spreadsheet (toolbar icon F6) and set Wide angle ray aiming mode (warm) to On. Then double click on the spot diagram window to update the display with the current lens data. The result is shown below.
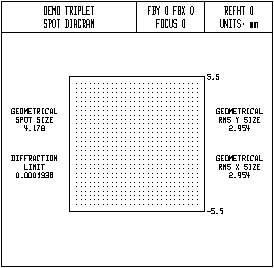
Now the ray pattern is square, as it should be, when pupil aberrations are eliminated. The warm operating condition was originally introduced in OSLO to solve some problems connected with tracing rays through wide angle systems, as its name suggests. However, it has a broader application, as shown above. The behavior of real ray tracing routines is changed when warm is on, in two ways. First, as shown above, rays are aimed at points in the reference surface rather than the entrance pupil. The fractional aperture coordinates used to describe a ray are normalized to the reference surface radius rather than the entrance beam radius. Second, for systems where the object is at infinity (defined as a distance equal or greater than 1.0e8), the fractional object coordinate is an angle, relative to the object field angle given in the surface data spreadsheet. Thus, for example, if the field angle is set to 45 degrees, then a fractional object coordinate of 1.0 equals 45 degrees, a fractional object coordinate of 2.0 equals 90 degrees, and a fractional object coordinate of 3.0 equals 135 degrees. This convention allows OSLO to handle systems covering semi-fields of greater than 90 degrees.
